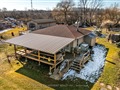
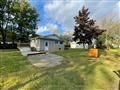
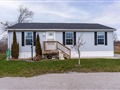
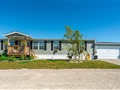
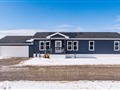
39 Wilcox Dr
$273,884
Comparative Market Analysis
Apr 5, 2025
NOT AN ACTIVE LISTING
Historical Performance
| Period | $ Change | % Change |
| 1 Day | +$18 | +0.007% |
| 7 Days | -$169 | -0.061% |
| 30 Days | -$979 | -0.356% |
| 3 Months | -$1,426 | -0.518% |
| 6 Months | +$4,111 | +1.52% |
| 1 Year | -$15.0k | -5.18% |
| 3 Years | +$41.0k | +17.6% |
| 5 Years | +$65.9k | +31.7% |
| 10 Years | +$137k | +99.7% |
List My Property
Real Estate Statistics
Financing Solutions
Browsing History
13 River Front Lane, Haldimand
2 seconds ago
853 Concession 4 Rd, Haldimand
3 seconds ago
5 Iron Bridge Crt, Haldimand
5 seconds ago
22 Sims Lock Rd, Haldimand
6 seconds ago
AS SEEN ON

Are You a Licensed Real Estate Agent or Broker?